Schedule a demo with us
We can help you solve company communication.
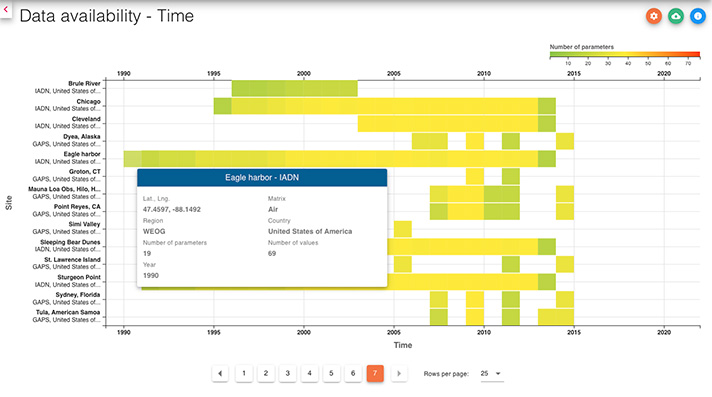
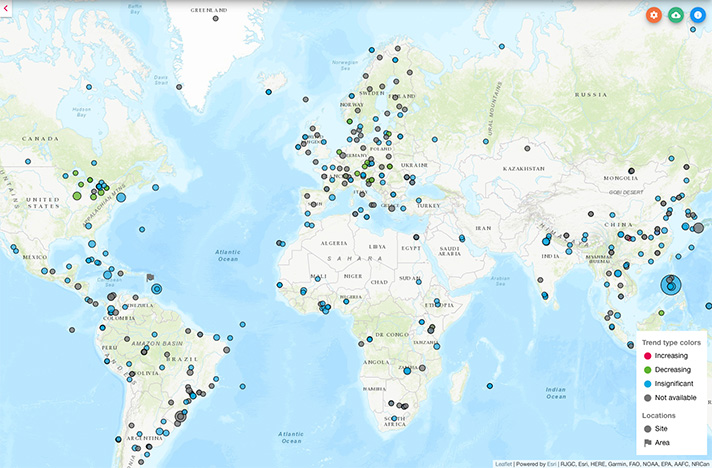
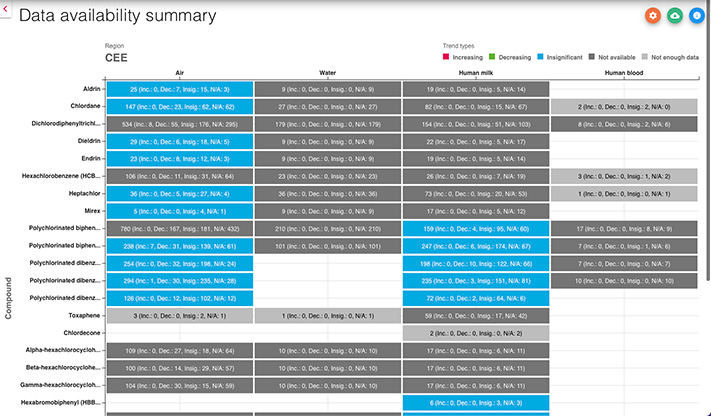
Visualisations are supporting the preparation of regional POPs monitoring reports and show available data (POPs concentrations) in the GMP data warehouse in four core matrices.
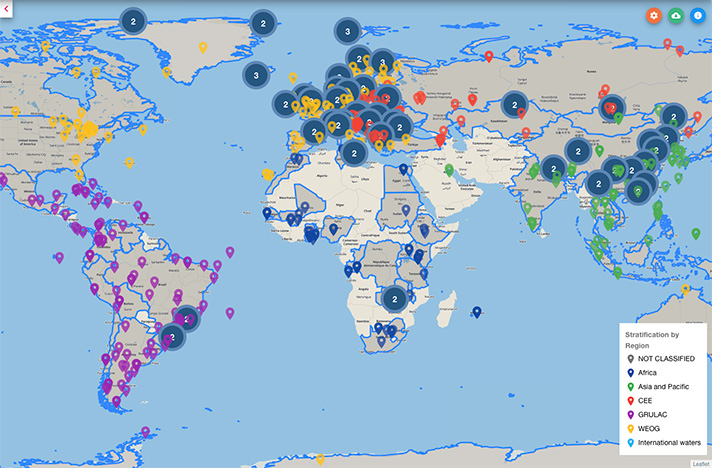
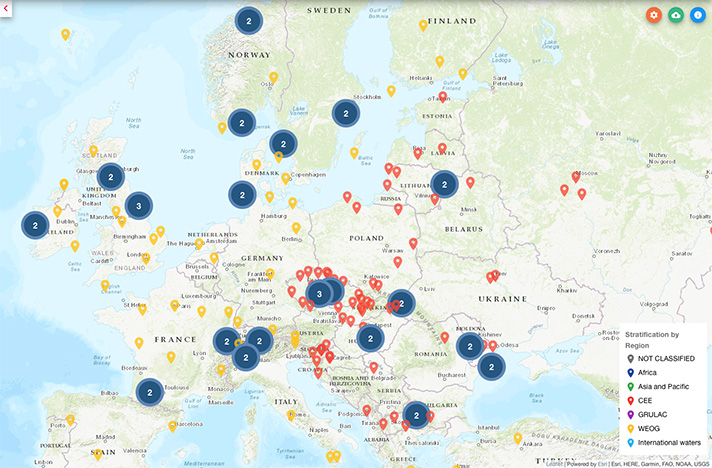
Spatial distribution offers general overview of sampling sites across the globe. It displays individual sampling sites as points in a map, it clusters multiple point sites in case the occupate the same or similar geographical position together with countries. Point sampling sites are typical for air and water monitoring, human milk and blood monitoring is reported per countries according to methodology of WHO.
Features:
change background map type
switch on/off site clustering
select stratification (colour coding) of sampling sites
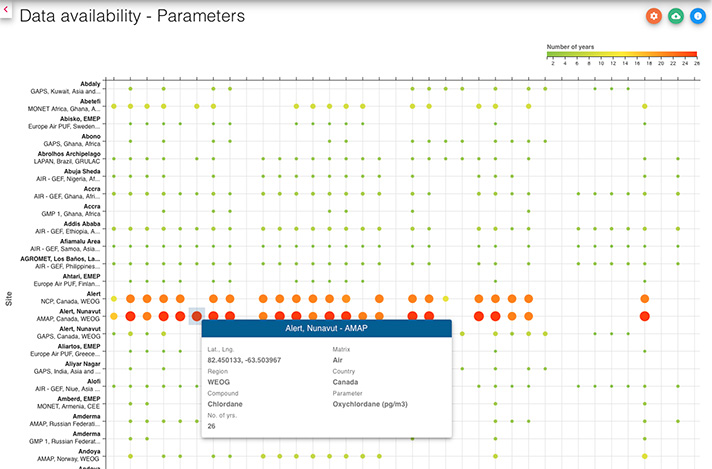
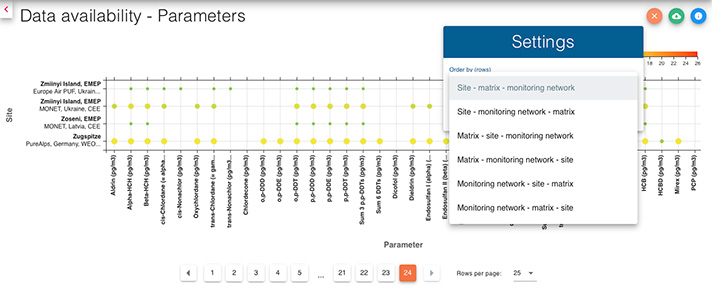
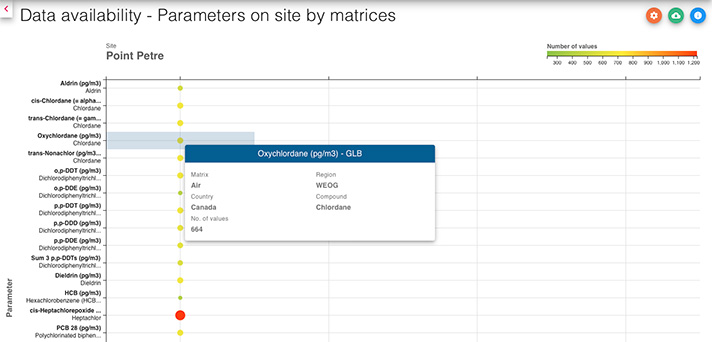
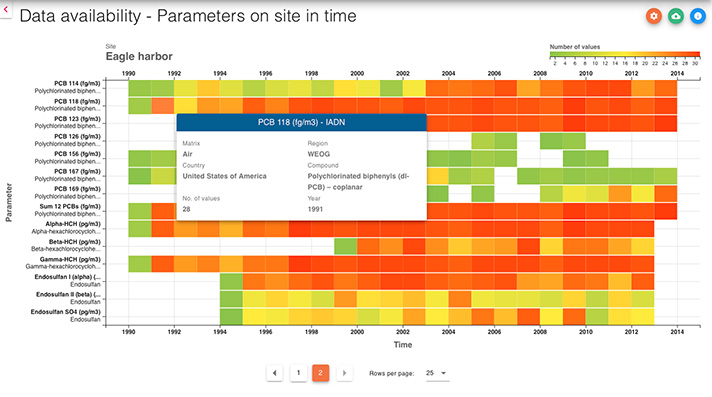
Available data – Parameters analytical view shows how many data records or samples is available for individual sampling sites.
At the row level sampling sites are displayed with information as its name, monitoring network name and country and region of origin.
Columns are created for each chemical parameter available in displayed dataset.
Value displayed at the intersection of rows and columns is number annually aggregated data records. Size and colour indicate the value.
Features:
change background map type
switch on/off site clustering
select stratification (colour coding) of sampling sites
...
Features:
change background map type
switch on/off site clustering
select stratification (colour coding) of sampling sites
Features:
change background map type
switch on/off site clustering
select stratification (colour coding) of sampling sites
...
Features:
change background map type
switch on/off site clustering
select stratification (colour coding) of sampling sites
...
Features:
change background map type
switch on/off site clustering
select stratification (colour coding) of sampling sites
...
Features:
change background map type
switch on/off site clustering
select stratification (colour coding) of sampling sites
...
Features:
change background map type
switch on/off site clustering
select stratification (colour coding) of sampling sites
...
Features:
change background map type
switch on/off site clustering
select stratification (colour coding) of sampling sites
...
Features:
change background map type
switch on/off site clustering
select stratification (colour coding) of sampling sites
...
Features:
change background map type
switch on/off site clustering
select stratification (colour coding) of sampling sites
...
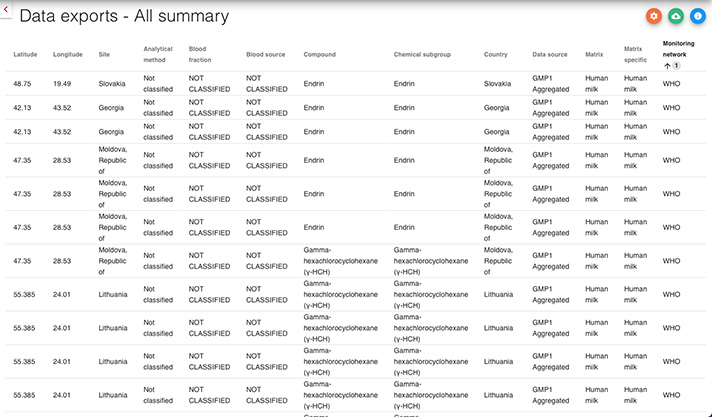
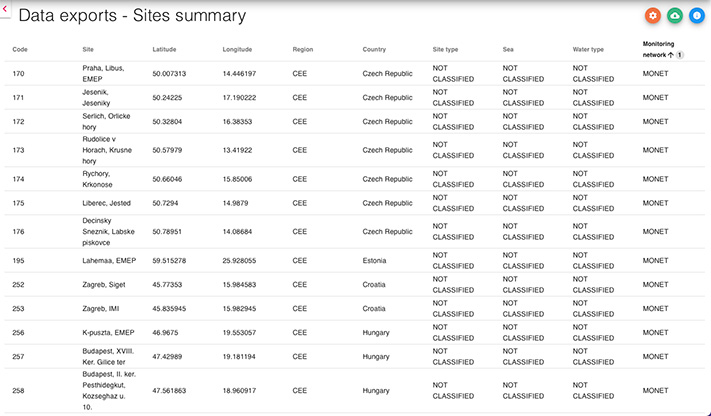
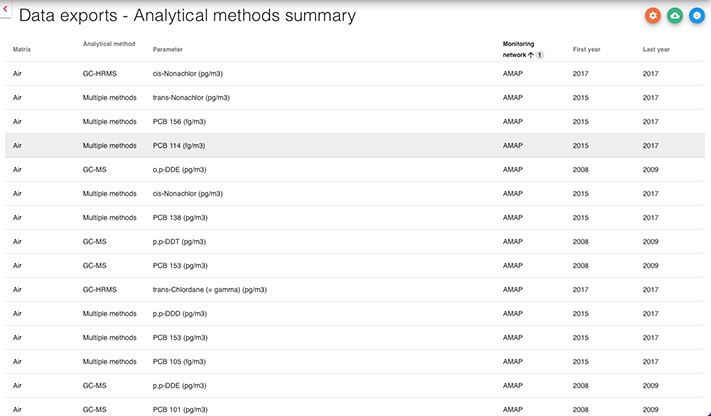
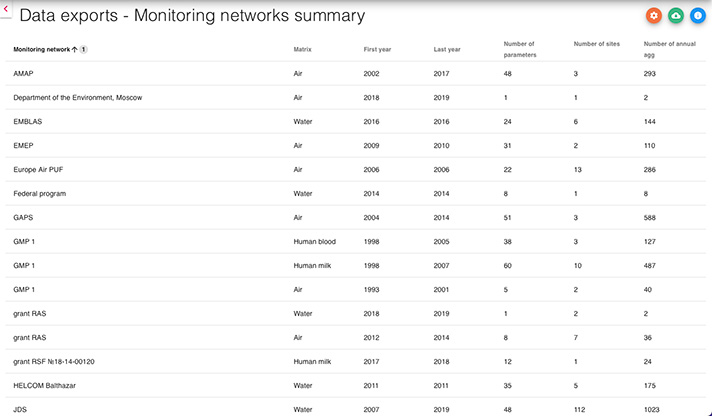
Exports:
All data
Sampling sites
Analytical methods
Monitoring networks